Asian American and Pacific Islanders (AAPIs) are a large and growing population in the state of California and among the UC student population. It is a culturally and economically diverse population that has made numerous contributions, but also faces enormous challenges. Unfortunately, their concerns have not received the policy attention they deserve, and the existing public image is often distorted by simplistic stereotypes. As a public institution, UC has an opportunity to apply its research expertise to the study of AAPI related policies. The UC AAPI Policy MRP has been organized to meet the challenge by developing a network of UC faculty researchers who are committed to supporting and conducting applied research relevant to AAPIs in California and the rest of the nation.
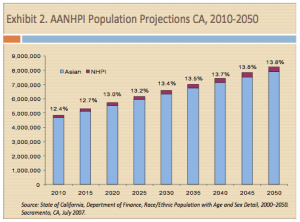
The anti-Asian movement led to the earliest restrictive laws in this nation, which forced Asians into urban ghettos, segregated them in public schools, prevented them from testifying in courts, prohibited them from owning land, and denied them the right to marry non-Asians. Racially motivated immigration policies started with the 1882 Chinese Exclusion Law and later the Executive Order 9066, which resulted in the internment of over 100,000 people of Japanese ancestry. Since the elimination of racially biased quotas in 1965, AAPIs today comprise about 13% of the state’s population and are projected to comprise as much as 20% by 2025.
Though they are the fastest growing minority population, there is a lack of of policy attention to the AAPI population because they are viewed as a successful minority. For instance, AAPIs make up a disproportionate large share of those with advanced degrees in engineering and the sciences, and stimulate economic growth through entrepreneurship. However, aggregate numbers hide underlying problems, such as how their per capita income is more than 10% lower than for non-Hispanic whites. Native Hawaiians and Pacific Islanders are 40% lower than for non-Hispanic whites. In 1999, the median family income of AAPIs also varied by Asian ethnic group. While Asians overall had a median family income of $60,794, Cambodian, Hmong and Laotian median family income was below $30,000. In addition, while Asians overall have a poverty rate of less than 13%, some groups, such as the Cambodian, Hmong, and Laotian have poverty rates significantly higher at 40%, 53% and 32%, respectively.
In addition to class diversity, there is also great variety of ethnicities, cultures and languages represented, with individuals from at least 30 different countries. The 2000 Census showed that 67% of the total AAPI population in California is foreign born and 22% of California’s adults who spoke an Asian or Pacific Islander language are limited in their English language ability. Thus, AAPI populations face challenges similar to other immigrant populations.
While educational attainment is high, there are troubling issues. In the past, many Asian American applicants had a difficult time being admitted to the UCs. Other AAPI groups face other problems, such as high dropout rates for Pacific Islander youths that are comparable to those experienced by U.S. born African Americans and Latinos. Moreover, the low college attendance rate for Pacific Islanders is similar to the rate for U.S. born African Americans and Latinos.
